Documentation
Introduction to Planfeld
Planfeld Major Functions
Planning Session
Monitoring a Campaign
Viewing Monitor Campaign Reports
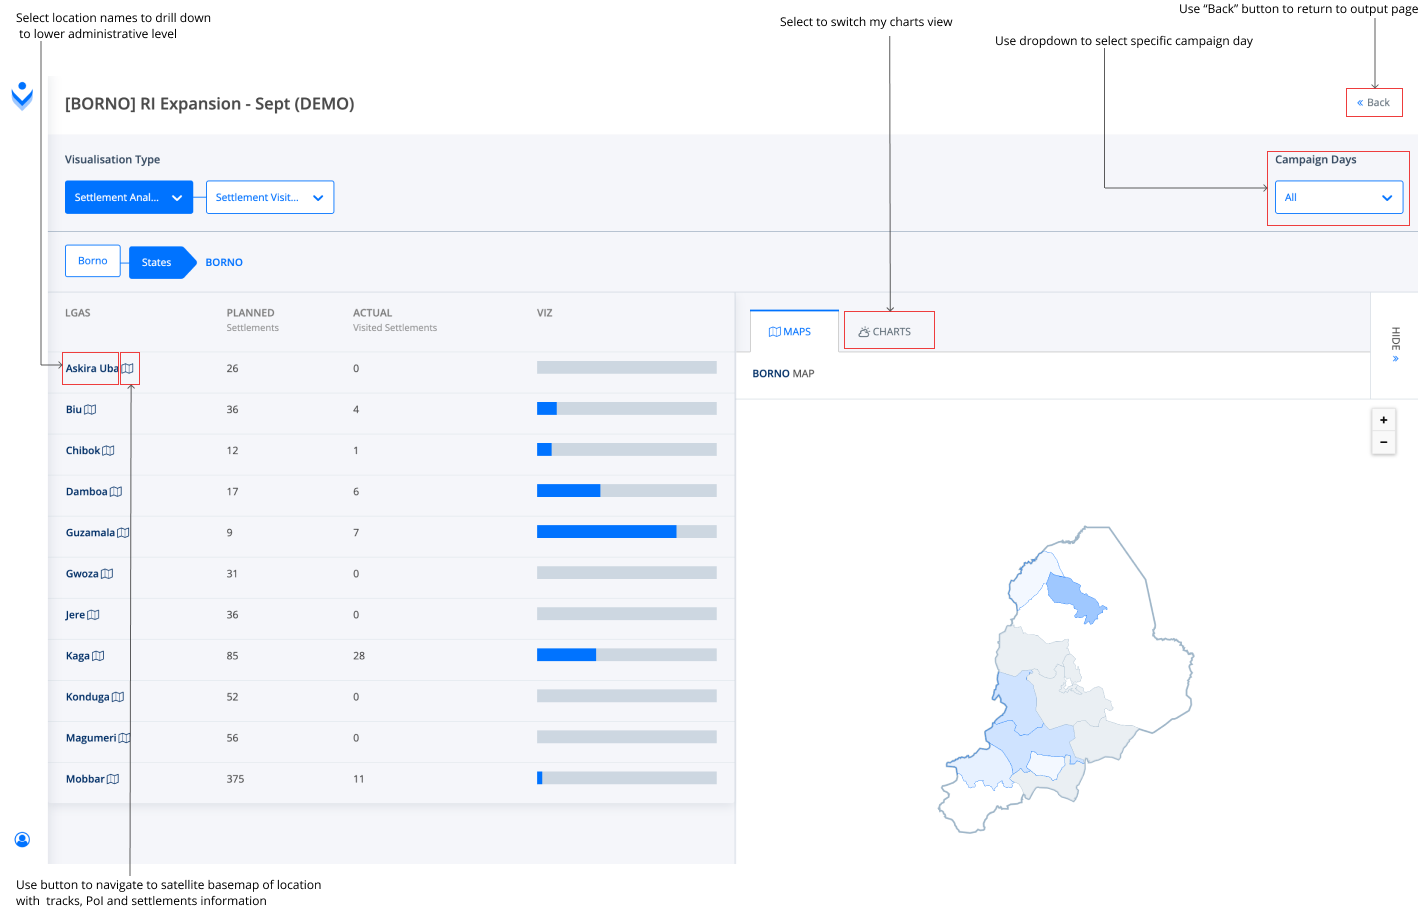
If you select “View Reports”, the window below showing a settlement analysis for visitations table (1), corresponding bar chart (2) and a map (3) will be displayed by default.
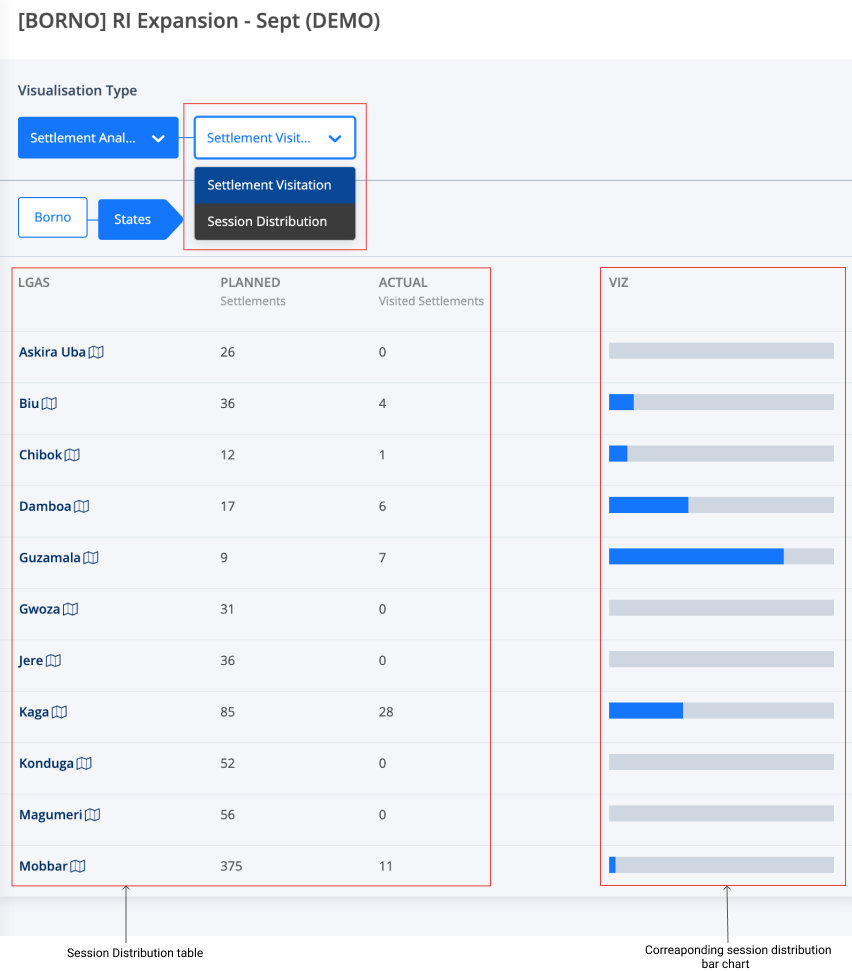
You can switch to view settlement analysis by session distribution.
Simply click on the dropdown tab at the front of the “Settlement Analysis” and toggle between “Settlement Visitation” and “Session Distribution”
Also, you can switch from Settlement Analysis to Population Analysis.
Simply click on “Settlement Analysis” dropdown and select “Population Analysis”.
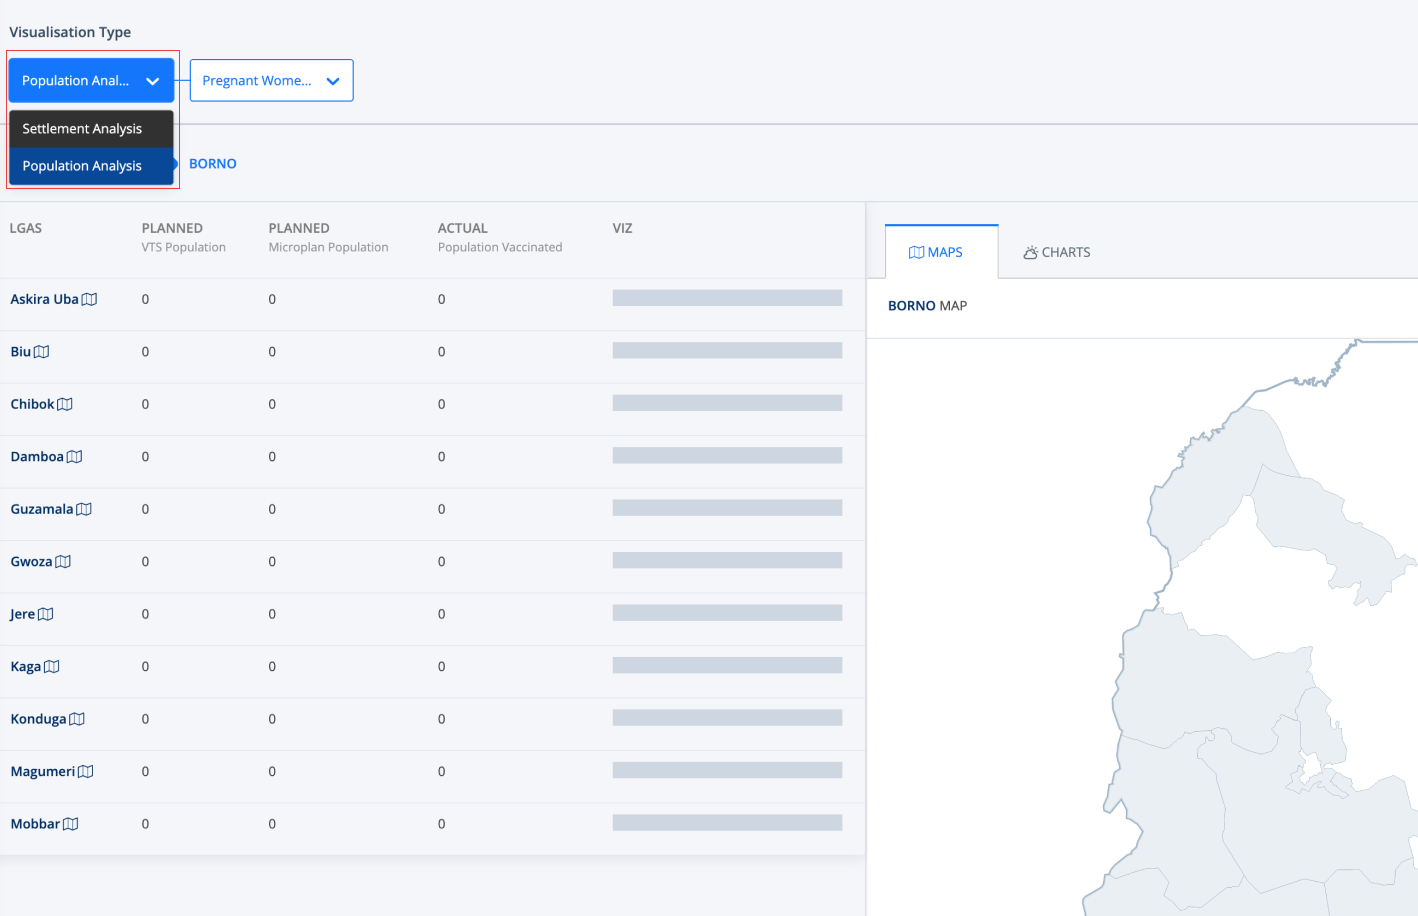
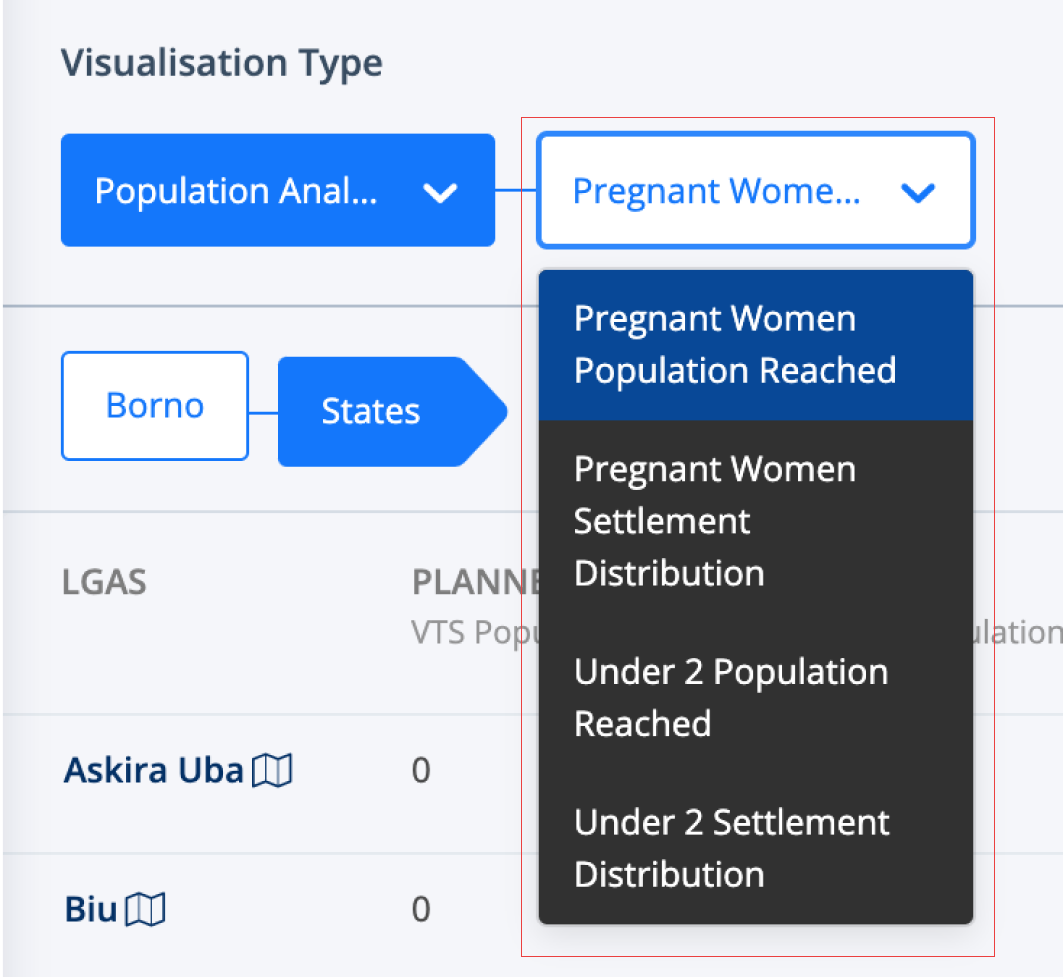
Note: You can also switch views using the dropdown for the different demography that the campaign is targeted at.
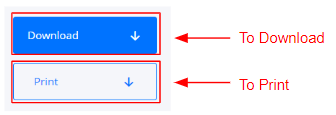
Note:
You can either decide to “Download” or “Print” the report and analytics for further usage by locating and selecting the appropriate tab shown below.
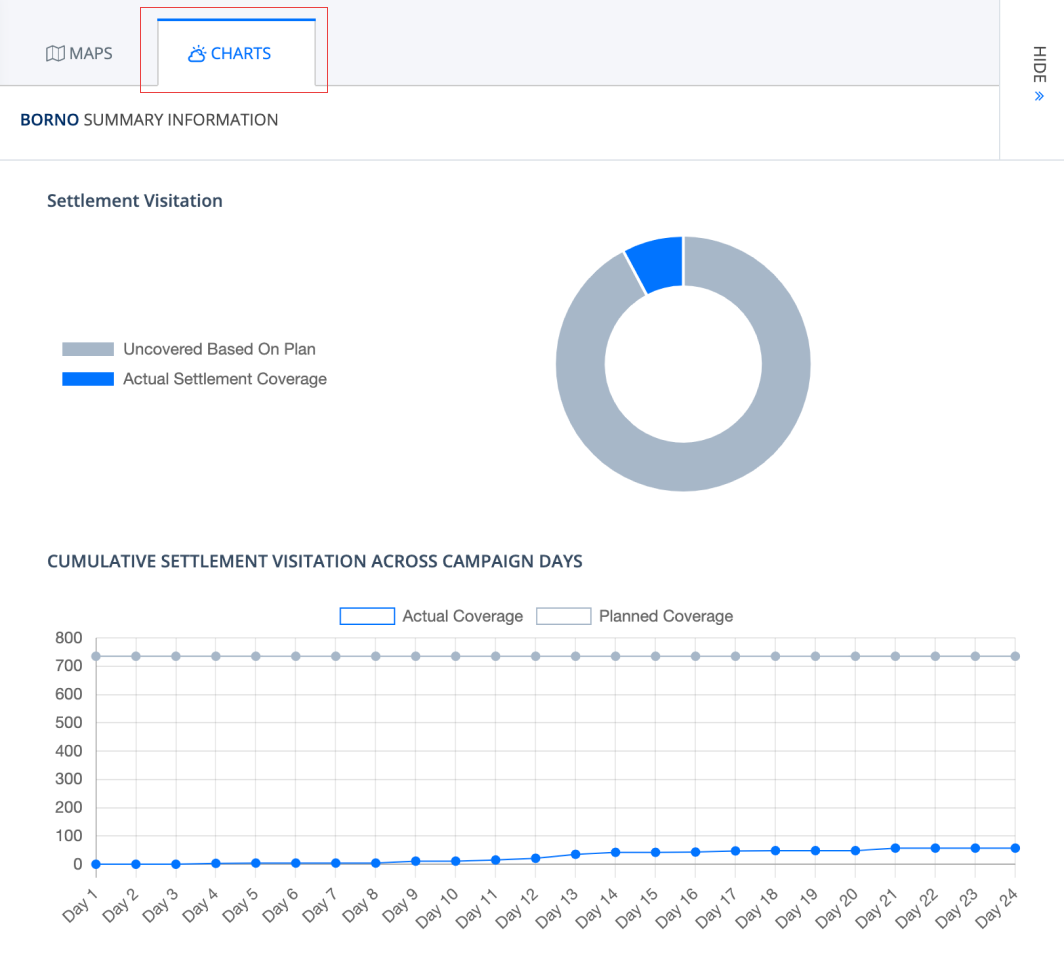
You can also change the default map views for the report to charts. Simply select the “Charts” tab next to the “Maps” tab as illustrated in the figure below.